Inter-cell Signaling Communication Network Discovery
Introduction
You can find the signaling communication network Discovery analysis in the “Communication and Drug” section. Signaling communication network Discovery analysis allows you to uncover the down-stream signaling of ligand-receptor of interest. Signaling communication network discovery use the ligand-receptor interaction database. For more information about setting ligand-receptor interaction database, see Set up.

-
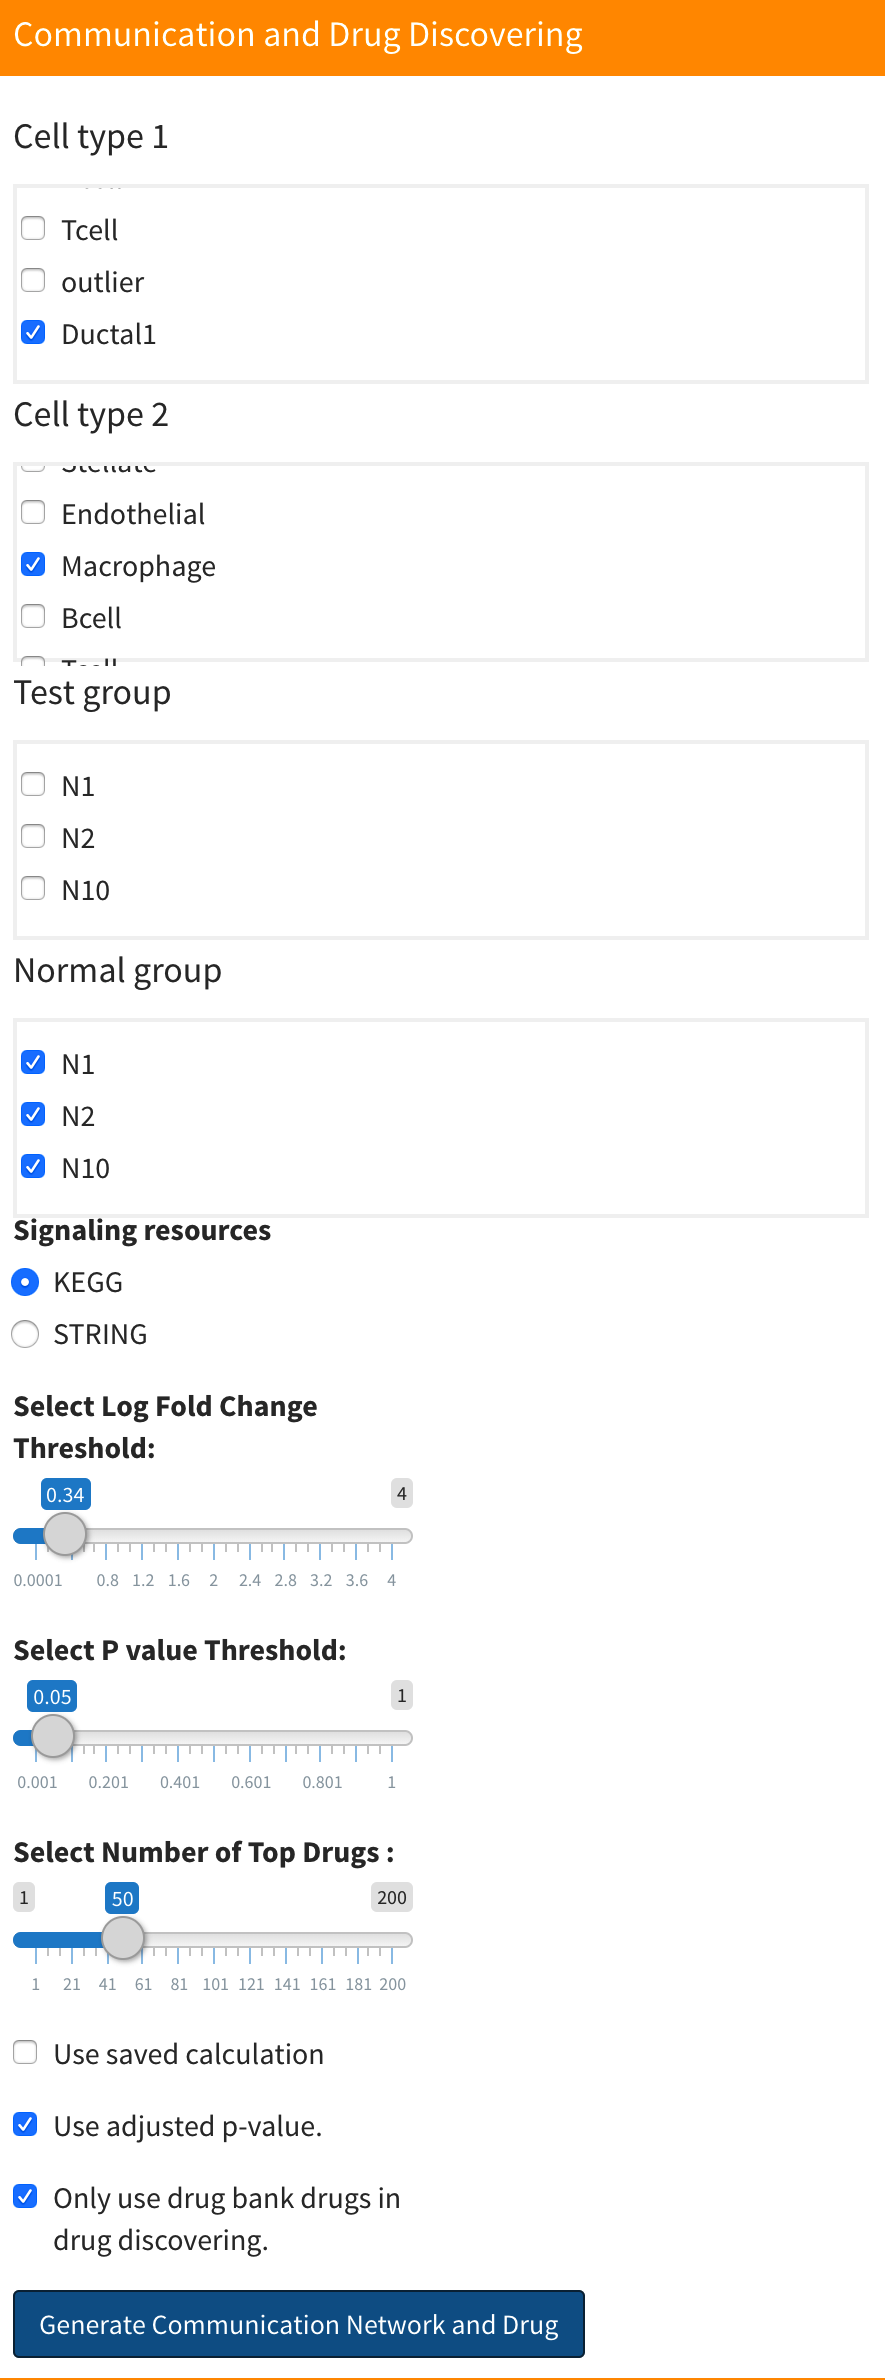
First, select the two cell types you wish to analyze, along with the respective test and control groups.
-
Next, choose the up-regulated log fold change threshold, p-value threshold,signaling resources and number of drugs. Notes that the sc2MeNetDrug will use different methods for different signaling resources, for more information, see Methodology part.(We would recommend you use KEGG since the computation time of SGTRING is much longer). The number of drugs is related to the drug discovering part. You can find more information in Drug discovering.
-
If you’re analyzing a specific cell-cell combination for the first time, ensure the “Use saved calculation” checkbox is unchecked. If you’ve previously computed results for that combination and merely want to adjust thresholds, enable the “Use saved calculation” option to reduce computation time. Be aware, for any given cell-cell combination, the application retains only the most recent computation. So, if you’re maintaining the same cell-cell combination but changing the test or control group, deselect the “Use saved calculation” checkbox.
-
The “Only use drug bank drug in drug discovering” check box is related to the drug discovering part. You can find more information in Drug discovering.
-
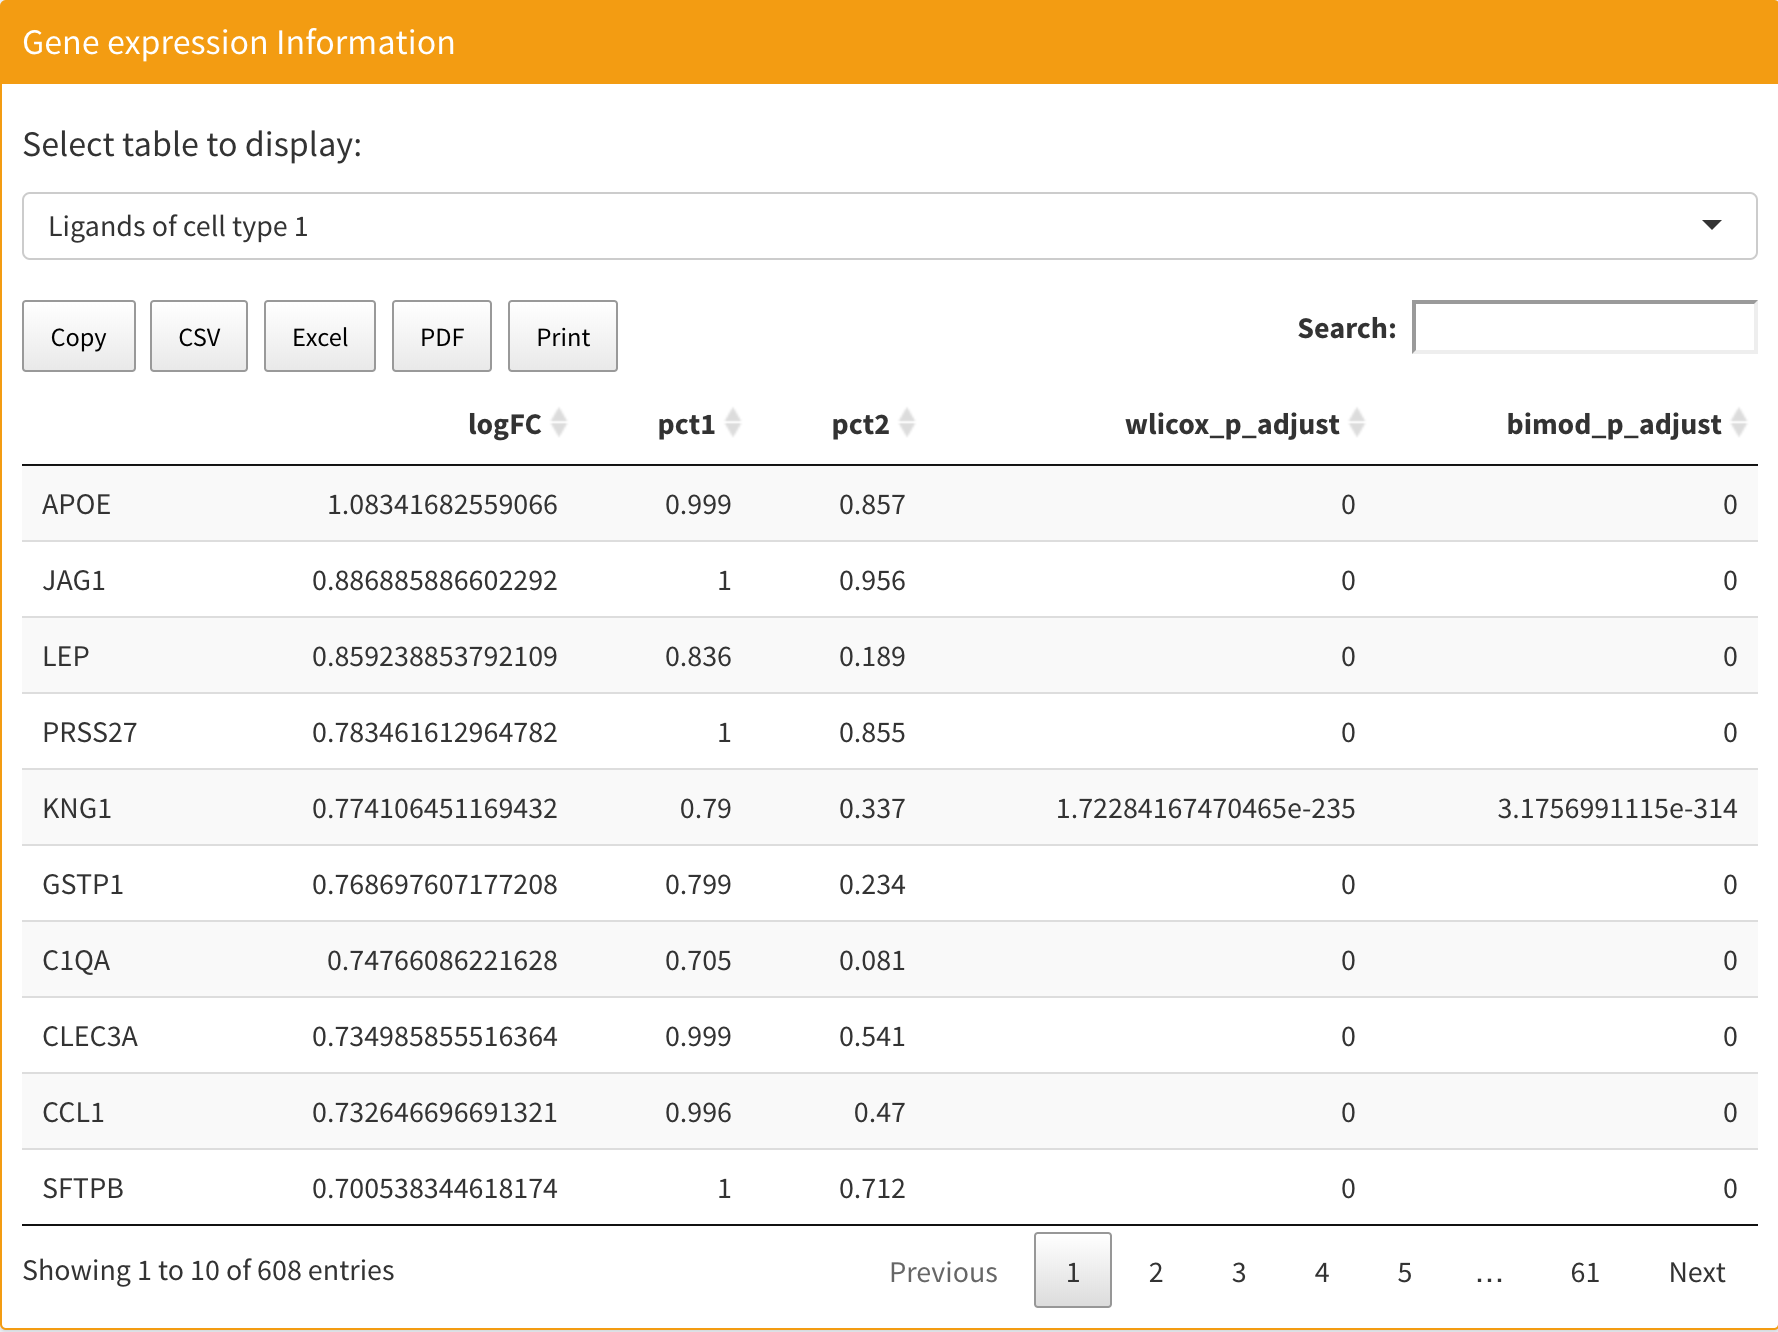
After computation, you can see the gene expression information table on the right. There are four tables that show ligand and receptor information for both two cell types. You can select certain tables to be displayed on the top. Each table contains five columns. The first is the log fold change, the second and third columns are expression percentages in the test and control groups respectively, the fourth columns is the Wilcoxon rank sum test adjusted p-values, and the fifth column is bimod test adjusted p-values based on the Bonferroni correction.

- Below the table is network plot result. You can select the plot you want to display in here:

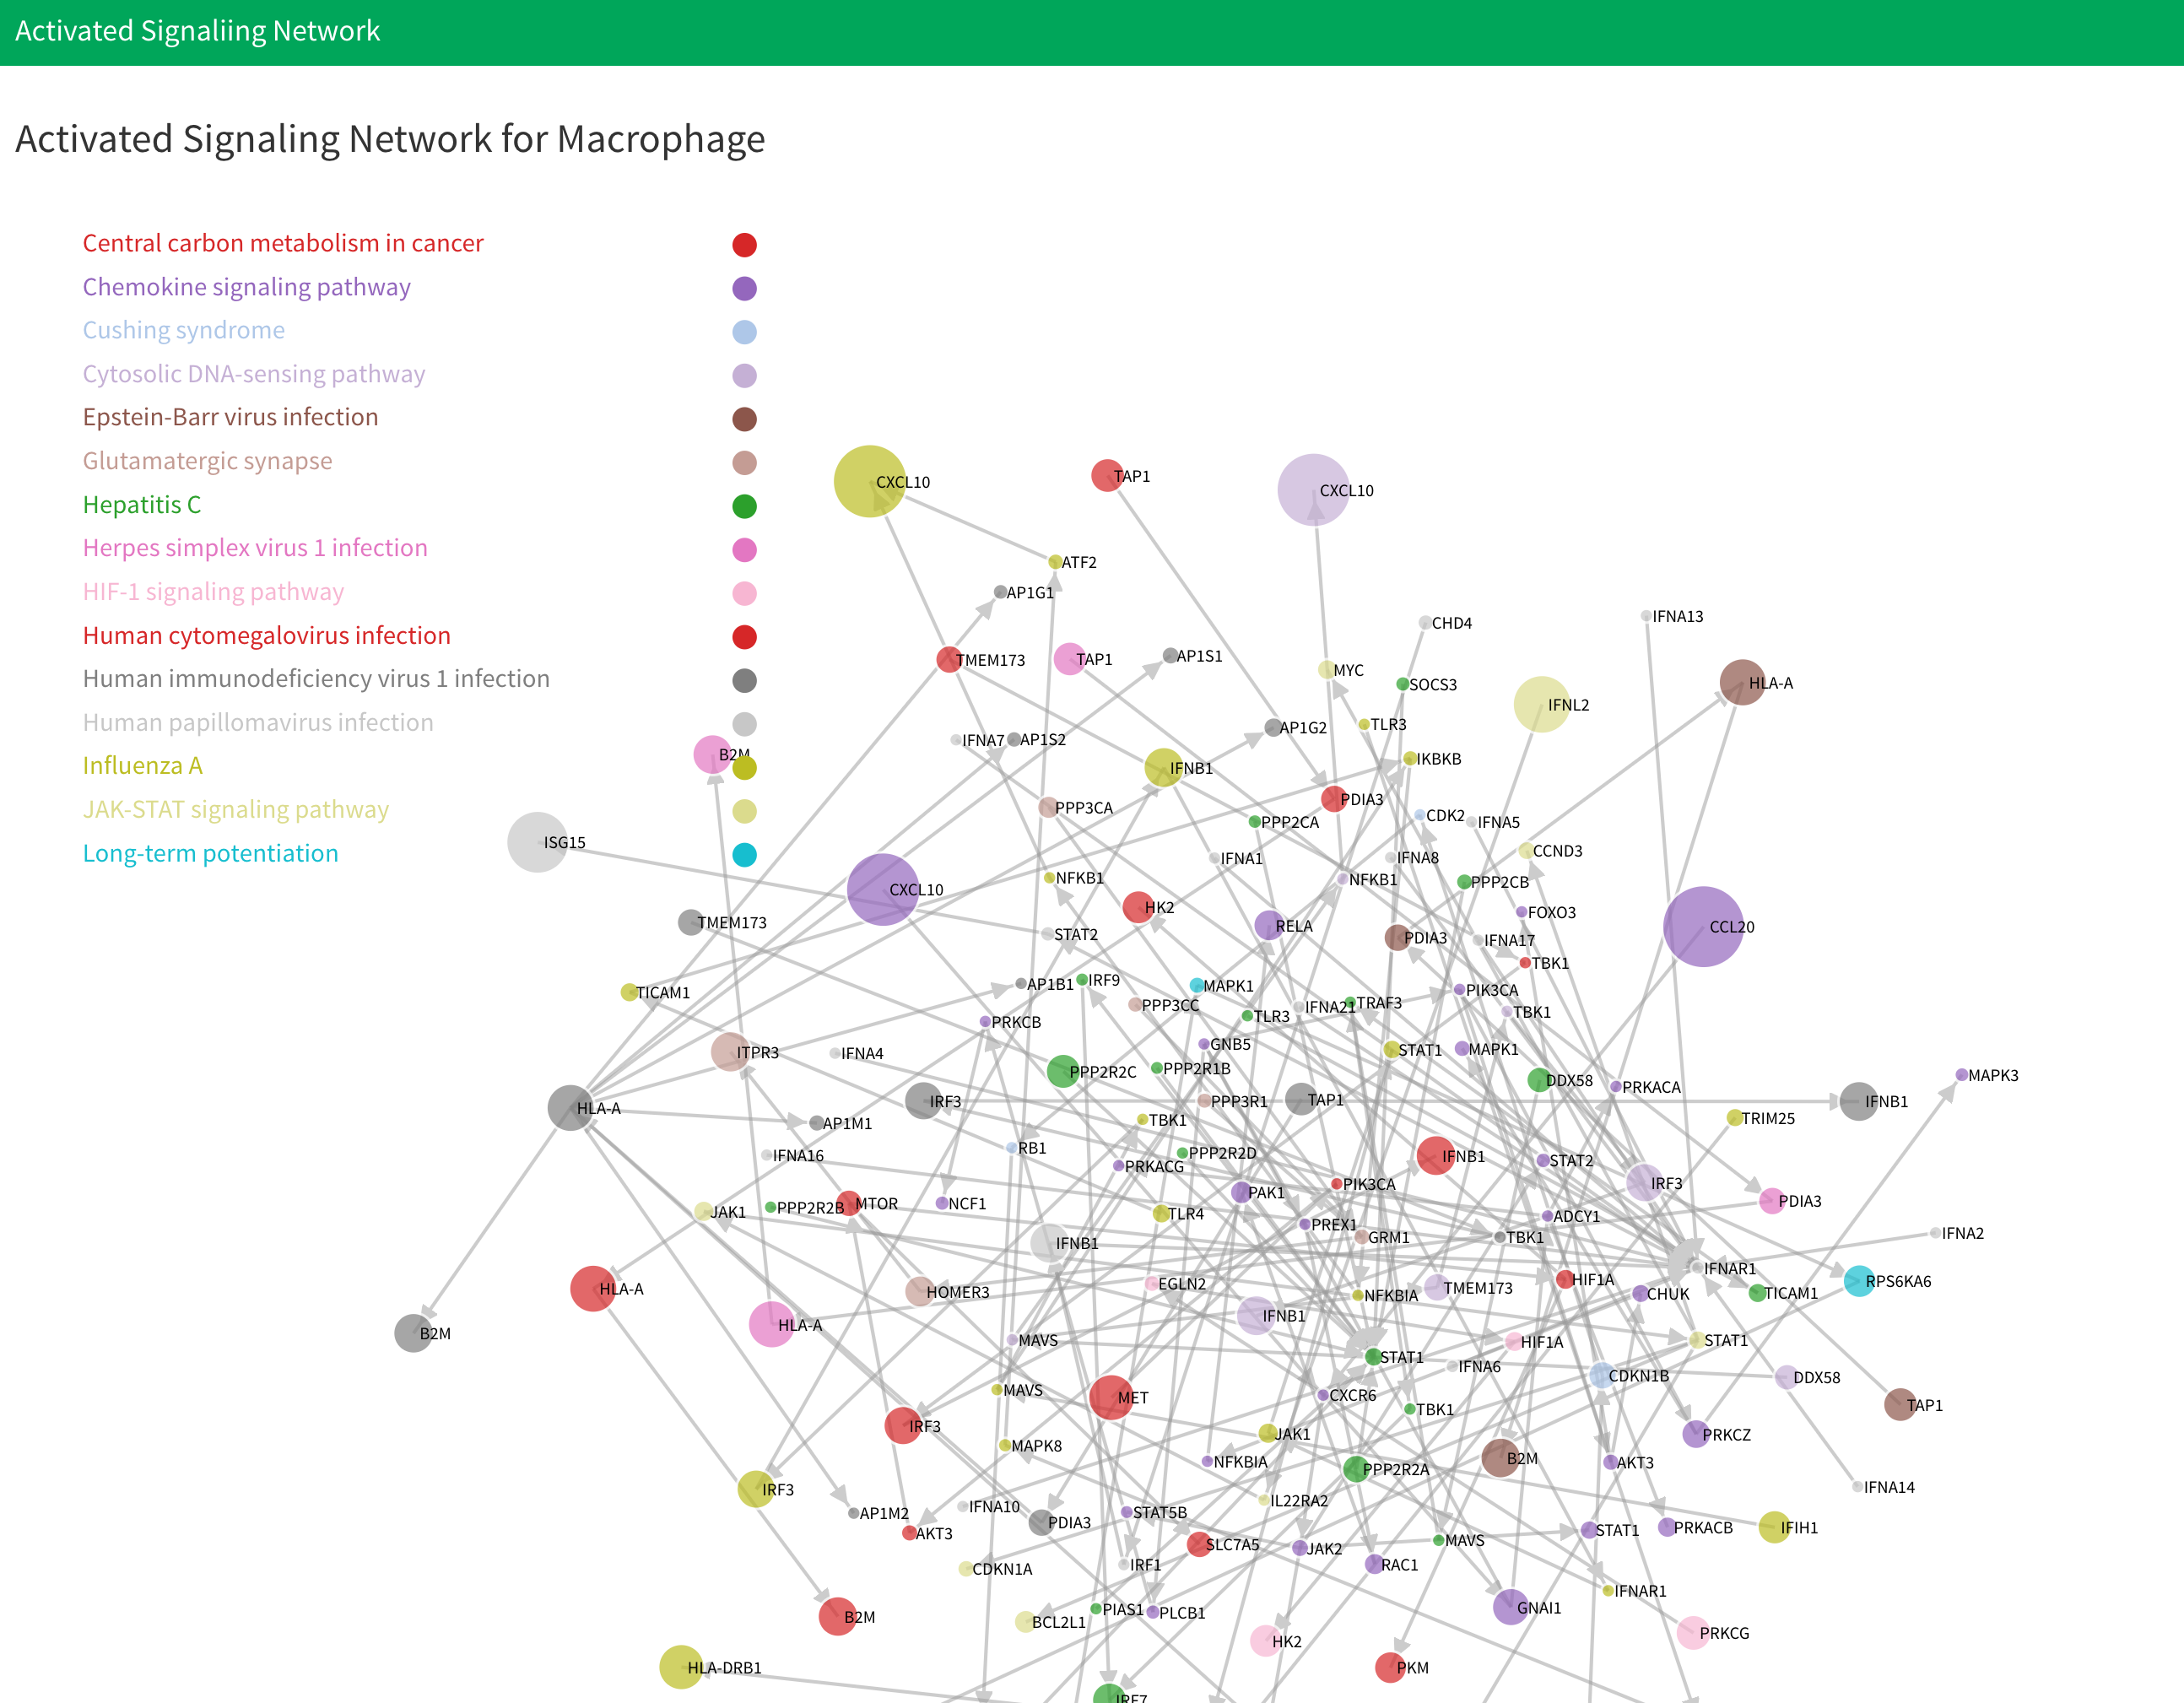
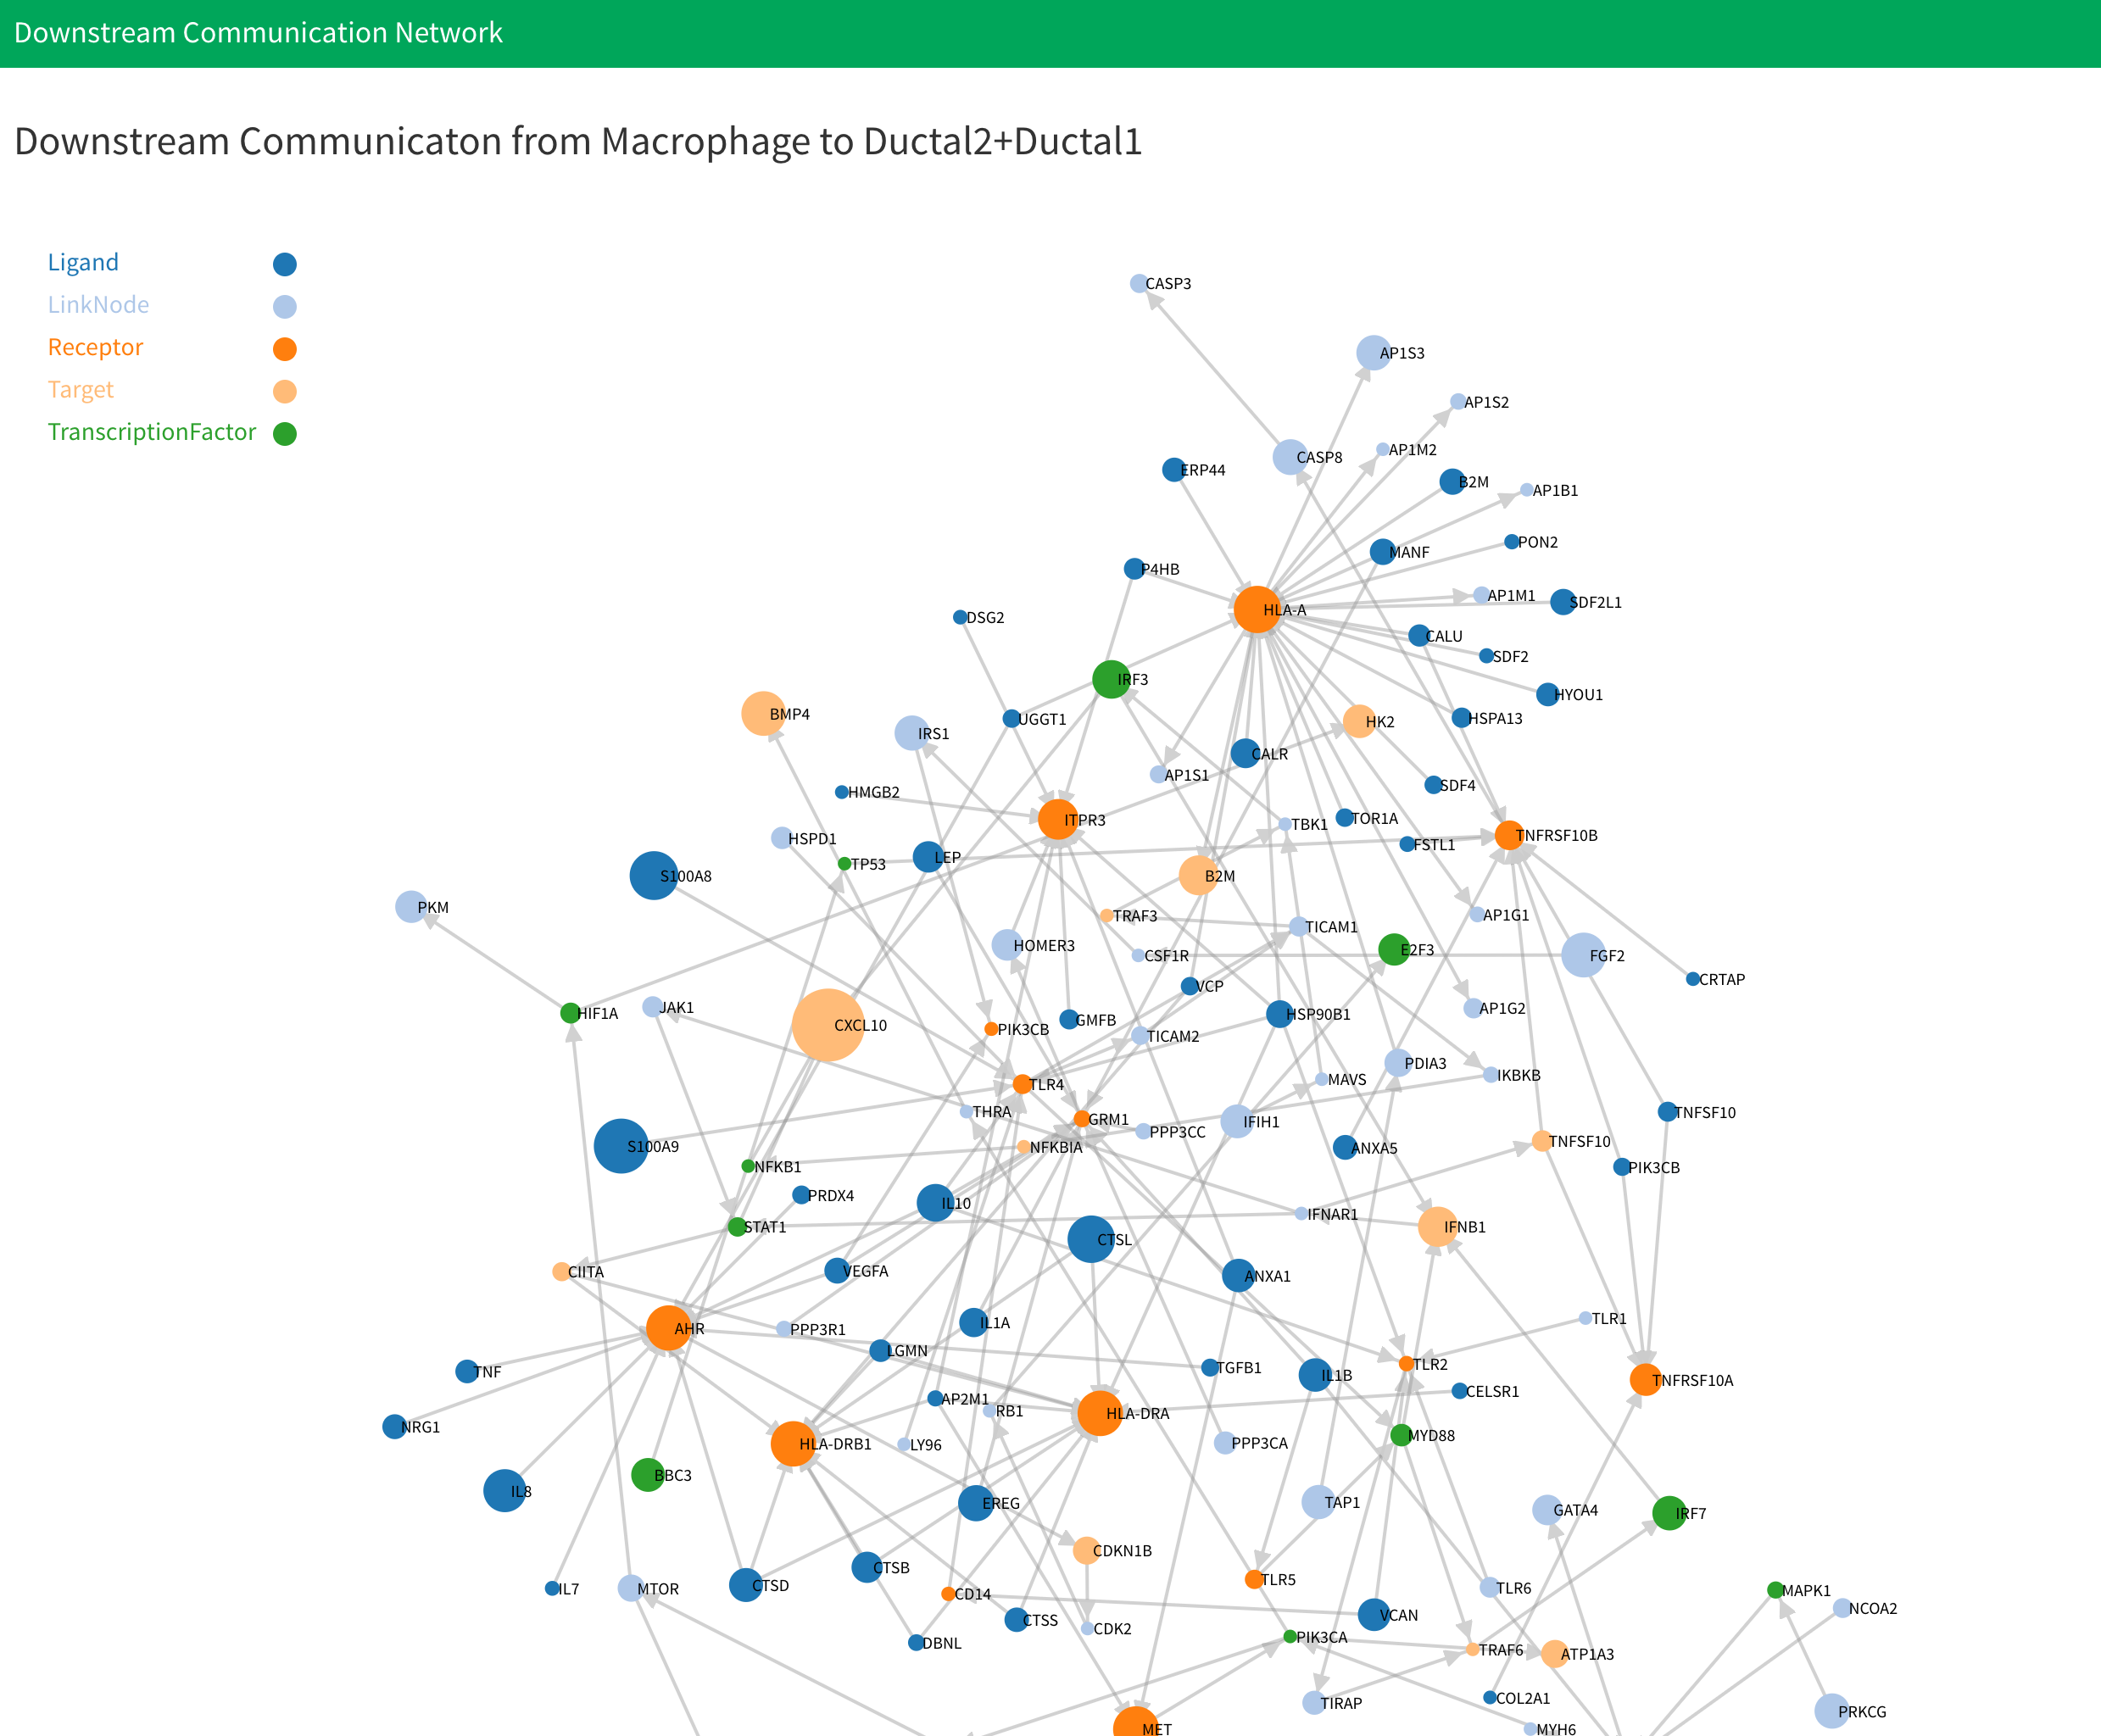
There will have four plot be generated. They are “Activated signaling network of cell type 1”, “Activated signaling network of cell type 2”, “Downstream signaling network from cell type 1 to cell type 2” and “Downstream signaling network from cell type 2 to cell type 1”. For the first two plot, the genes are labeled by the signaling pathway genes belong to. Notice that if there are more than 15 signaling pathway be activated, we will only display the first 15 signaling pathways. The last two plots are downstream signaling network. The genes are labeled by its type. For each plot, the size of node denote the fold change of genes. The larger nodes mean the higher fold change.


Data
All the data generated in analysis is saved in the cellCommunication directory inside the working directory. Inside the directory, each cell-cell combination will have their own directory to save the results named “CellType1-CellType2”. For example, if cell type 1 was “Endothelial” and cell type 2 was “Fibroblast”, the directory will be named as “Endothelial-Fibroblast”. If you selected more than one cell type in cell type 1 or cell type 2 during analysis, like “Endothelial” and “Tcell” in cell type 1 and “Fibroblast” in cell type 2, the directory will be named as “Endothelial+Tcell-Fibroblast”. Inside the cell-cell combination directory, you can see:
-
genesInformation.RData: Saves the log fold change and p-value information used for the differential expressed genes test in list variablegenesInformation. List has four variables, the first is the result for cell type 1 and the second is the result for cell type 2. The third and fourth are vector variables that indicate what cell type 1 and cell type 2 are. You can obtain them through:cell_type1_result<-genesInformation[[1]] cell_type2_result<-genesInformation[[2]] cell_type1<-genesInformation[[3]] cell_type2<-genesinformation[[4]]Each result is a data frame with five columns. The first is the log fold change, the second and third columns are expression percentages in the test and control groups respectively, the fourth columns is the Wilcoxon rank sum test adjusted p-values, and the fifth column is bimod test adjusted p-values based on the Bonferroni correction. You can obtain them through:
cell_type1_logFC<-cell_type1_result[,1]
cell_type1_pct1<-cell_type1_result[,2]
cell_type1_pct2<-cell_type1_result[,3]
cell_type1_wlicox_p<-cell_type1_result[,4]
cell_type1_wlicox_p_adjust<-cell_type1_result[,5]
cell_type1_bimod_p<-cell_type1_result[,6]
cell_type1_bimod_p_adjust<-cell_type1_result[,7]
For more information about the tables, you can check Seurat website.
-
ligRecInformation.RData: Saves the log fold change and p-value information for the ligands and receptors in list variableligRecInformation. List has four data frame variables, they are ligands for cell type 1, receptors for cell type1, ligands for cell type2, and receptors for cell type 2. You can obtain them through:cell_type1_ligands<-ligRecInformation[[1]] cell_type1_receptors<-ligRecInformation[[2]] cell_type2_ligands<-ligRecInformation[[3]] cell_type2_receptors<-ligRecInformation[[4]]Each data frame has the same structure with the data frame in
genesInformation, but only the genes that are listed in the ligands or receptors database are kept. -
activatedNetworkData1.RData: Saves the data for activated signaling network of cell type 1. Data have three variables, The first variable isactivated_network_nodes1, which saves information for all the nodes in the generated network. The variable is a data frame with four columns. The first column is the id for each gene. The second column is the gene symbol for each gene. The third column is the signaling pathway genes belong to. The final column is the size of each gene used for display. The second variable isactivated_network_edges1, which saves edge data for all the nodes in the generated network. The variable is a data frame with two columns. The first column is source of each edge and the second column is target of each edge. The final variable iscell_type1save the cell type of corresponding network. -
activatedNetworkData2.RData: Saves the data for activated signaling network of cell type 2. Data have three variables, The first variable isactivated_network_nodes2, which saves information for all the nodes in the generated network. The variable is a data frame with four columns. The first column is the id for each gene. The second column is the gene symbol for each gene. The third column is the signaling pathway genes belong to. The final column is the size of each gene used for display. The second variable isactivated_network_edges2, which saves edge data for all the nodes in the generated network. The variable is a data frame with two columns. The first column is source of each edge and the second column is target of each edge. The final variable iscell_type2save the cell type of corresponding network. -
“CellType1_CellType2”: This directory saves data for downstream signaling network from cell type 1 to cell type 2, where “CellType1” and “CellType2” are cell types selected by the user. Inside the directory, you can see:
downstreamNetworkData.RData: Saves the data for downstream signaling network from cell type 1 to cell type 2. Data have four variables, The first variable isdownstream_network_nodes1, which saves information for all the nodes in the generated network. The variable is a data frame with four columns. The first column is the id for each gene. The second column is the gene symbol for each gene. The third column is the type genes belong to. The final column is the size of each gene used for display. The second variable isdownstream_network_edges1, which saves edge data for all the nodes in the generated network. The variable is a data frame with two columns. The first column is source of each edge and the second column is target of each edge. The final two variable arecell_type1andcell_type2save the cell type of corresponding network.
-
“CellType2_CellType1”: This directory saves data for downstream signaling network from cell type 2 to cell type 1, where “CellType2” and “CellType1” are cell types selected by the user. Inside the directory, you can see:
downstreamNetworkData.RData: Saves the data for downstream signaling network from cell type 2 to cell type 1. Data have four variables, The first variable isdownstream_network_nodes2, which saves information for all the nodes in the generated network. The variable is a data frame with four columns. The first column is the id for each gene. The second column is the gene symbol for each gene. The third column is the type genes belong to. The final column is the size of each gene used for display. The second variable isdownstream_network_edges2, which saves edge data for all the nodes in the generated network. The variable is a data frame with two columns. The first column is source of each edge and the second column is target of each edge. The final two variable arecell_type1andcell_type2save the cell type of corresponding network.
Video Demonstration
Methodology
The signaling communication network discovery analysis based on kegg signaling pathways in sc2MeNetDrug is done in several steps. First, differential expressed genes in each of the two cell types are discovered based on two tests: the Wilcoxon rank sum test, and the Likelihood-ratio test1. The genes that have log fold change values larger than the threshold value and adjusted p-values for both tests less than the threshold will be selected as differentially expressed genes. The tests are done by theFindMarkers function in theSeurat package with parameters set as test.use="wilcox" and test.use="bimod" for the two tests respectively.
To uncover the down-stream signaling of ligand-receptor of interest, a computational model, iCSC (inter-cell signaling communication discovery using scRNA-seq), was developed. Specifically, 2 background signaling resources were used: KEGG signaling pathways (curated) and STRING (general protein-protein interactions). For KEGG signaling pathways, the shortest paths starting from the given receptors to all the target genes (without out-signaling) were identified, denoted as \(p_{i,j} = (g_i, g_{k1}, g_{k2}, …, g_j)\), where \(g_i\) is the receptor, \(g_j\) is the target gene, and \(g_{km}, m=1, 2, …,\) are the genes on the shortest paths between \(g_i\) and \(g_j\) on the KEGG signaling pathways. Then an activation score for each path, \(p_{i,j}\), was defined as \(s_{i j}=\sum_{g_{m} \in p_{i j}} f c\left(g_{m}\right) /n\), where \(fc(.)\) is the fold change calculator, and n is the number of genes on the signaling path. Then signaling paths with activation scores greater than a given threshold will be selected to generate the inter-cell communication network of the ligand-receptor of interest.
For STRING background signaling network, there are much more genes (nodes) and interactions (edges) than KEGG signaling. Thus, the above model for KEGG does not work for STRING. Herein, we proposed a novel down-stream signaling network discovery model. Specifically, let \(G_{0}^{i}=\left\langle R_{i}, \emptyset\right\rangle\) denote the initialized down-stream signaling network of receptor \(R_i\). The update of the downstream signaling is defined as: \(G_{t+1}^{i}=f\left(G_{t}^{i}, G_{B}, V_{k 1}, k 2\right)\), where \(G_t^i\) and \(G_B\) is the current down-stream and background (STRING) signaling networks respectively. The edge, (protein interactions between \(g_i\) and \(g_j\) ) of background signaling network, \(G_B\) , is weighted as: \(w\left(e_{i j}\right)=\frac{1}{a b s\left(f c\left(g_{i}\right)\right.}+\frac{1}{a b s\left(f c\left(g_{j}\right)\right.}\) . \(V_{k1}\) is a vector including k1 candidate genes (based on the absolute fold change in the decreasing order) to be investigated and added to the down-stream signaling network. For any gene, \(g_{k} \in \operatorname{node}\left(G_{t}^{i}\right)\) , the shortest paths from \(g_k\) to the k1 candidate genes in \(V_{k1} \), will be calculated. Then, an activation score for each path \(p_{k,j} \) was defined as \(s_{kj}=\sum_{g_{m} \in p_{i j}} fc\left(g_{m}\right) /n \), where \(fc(.)\) is the fold change calculator and n is the number of genes on the signaling path. If \(n>k2 \) , the signaling paths will be discarded. In another word, the parameters k1 and k2 decide the search width and depth. Finally, the signaling path with highest activation score will be added to the down-stream signaling network. The process will be conducted iteratively until it reaches a network size limit, e.g., N nodes. The down-stream signaling network is generated by combining the down-stream signaling networks of all receptors \(G_{1}=U_{i} G_{t}^{i}\).
Finally, the downstream signaling network from cell type 1 to cell type 2 is generated by first filter the activated signaling network in cell type 2 and only save the network that have genes in our ligand-receptor interaction database. Next, We find all the differential expressed ligands in the cell type1. Finally, we link the ligands in cell type 1 and corresponding receptors in filtered activated signaling network of cell type 2 using ligand-receptor interaction database.
References
- McDavid, A. et al. Data exploration, quality control and testing in single-cell qPCR-based gene expression experiments. Bioinformatics 29, 461–467 (2013).